From raw survey data to clear insight, fast.
Go from raw exports to summarized dashboards that highlight significant statistical relationships in minutes, not months.
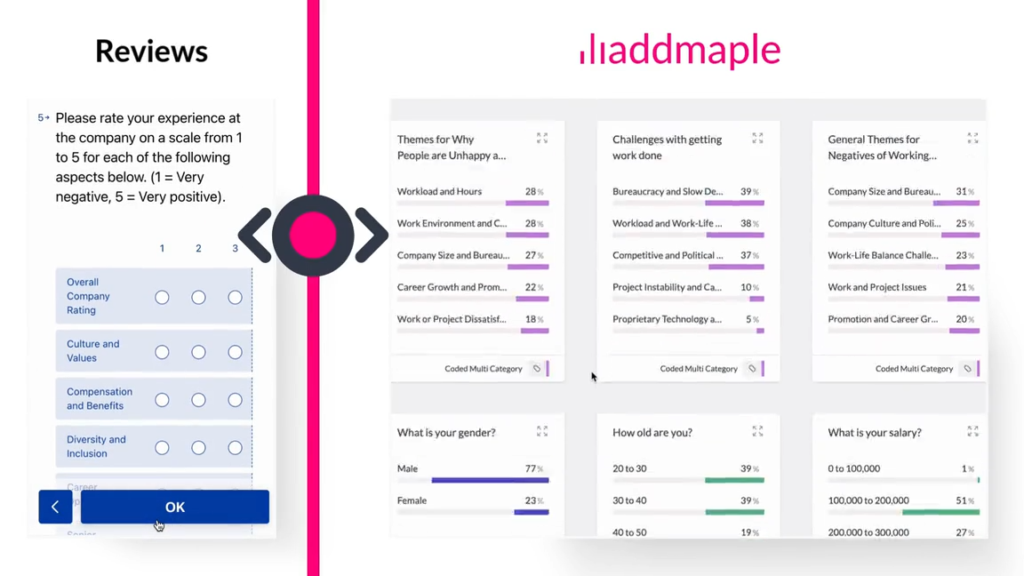
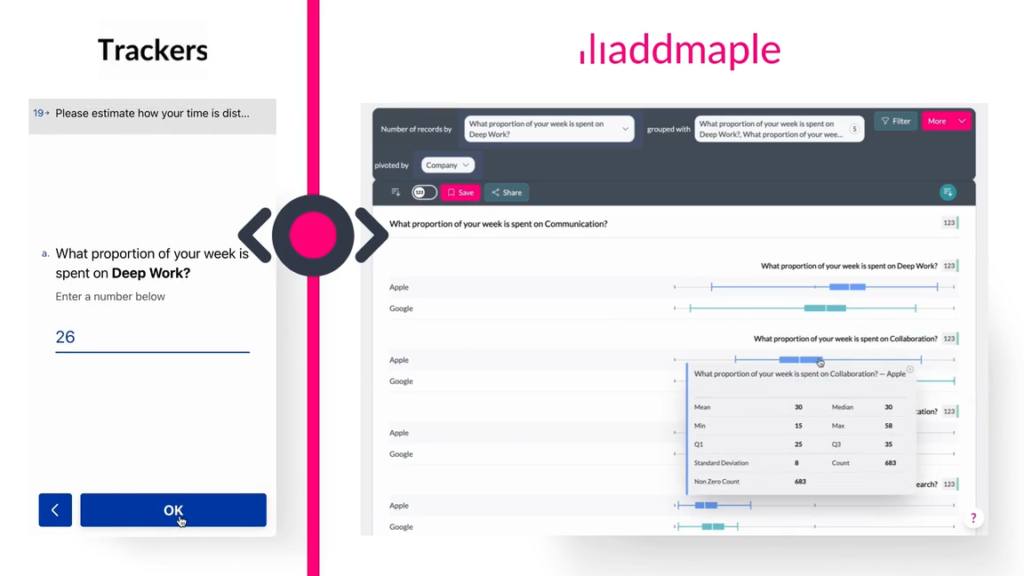
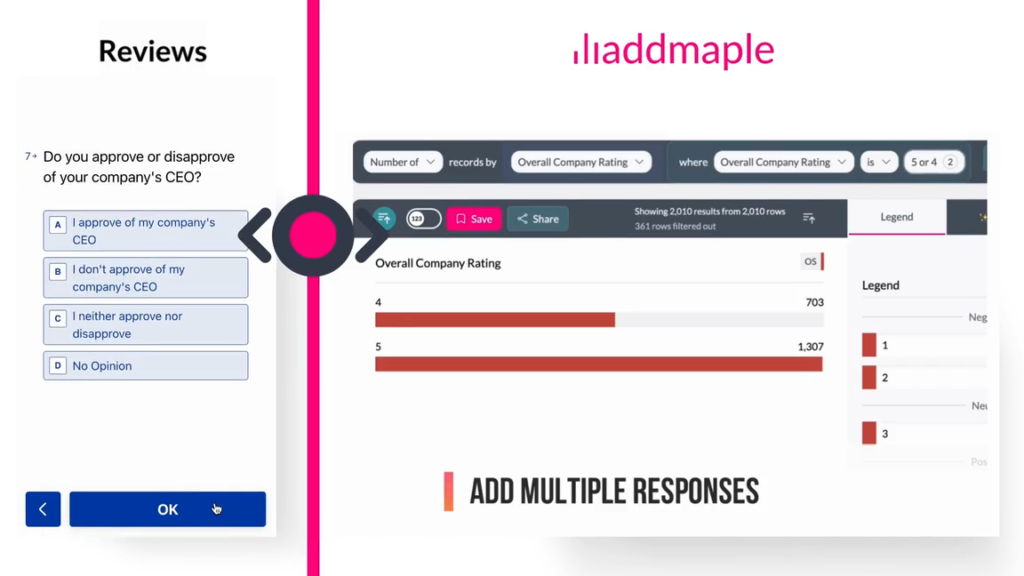
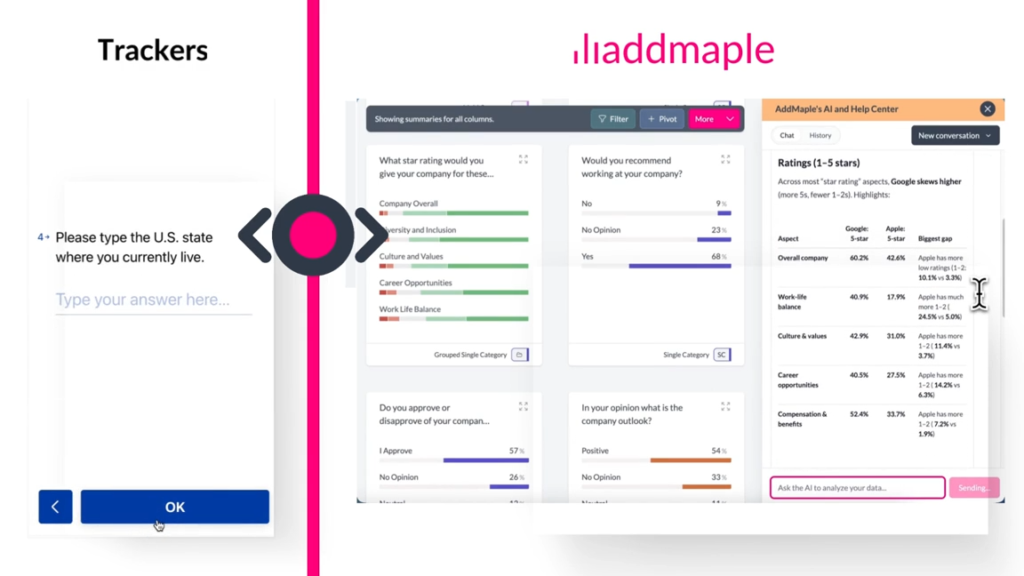
- Analyze any data export: Complex or simple, periodic or one-off. Upload SAV, CSV, or Excel, or connect from Qualtrics, QuestionPro, Typeform, and similar platforms. Every column becomes a chart or table in seconds.
- No manual prep or cleanup: Automatic data type detection handles multi-select, dates, numbers, percentages, currencies, matrix/grid, rating, and opinion questions so you can skip the wrangling and start exploring.
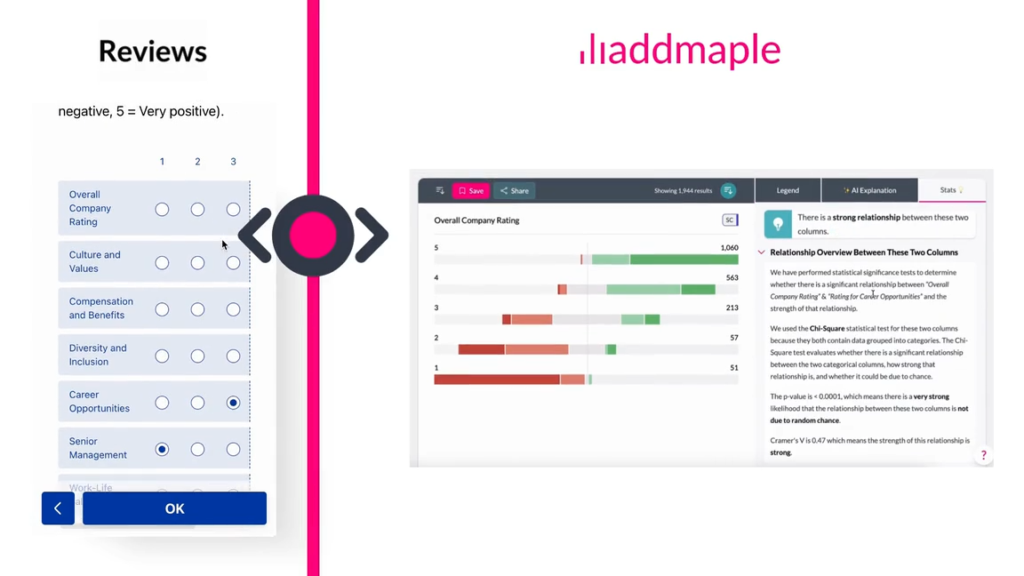
- Intelligent grouping for comprehensive analysis: Matrix and grid questions group into Likert scales or stacked charts automatically, ready for banners and pivots without reformatting.
- Sophisticated statistical tests, segmentation, cross-tabulation, weighting and pivots: Self-service crosstabs with significance testing across columns. Segment by demographics, response combinations, or free-text themes. Pivot two or more columns with a click.
One workspace for exploring, explaining, and sharing results
- Find what matters first: Rank relationships by statistical strength, run key driver analysis, and build banners so the strongest patterns surface before you dig deeper.
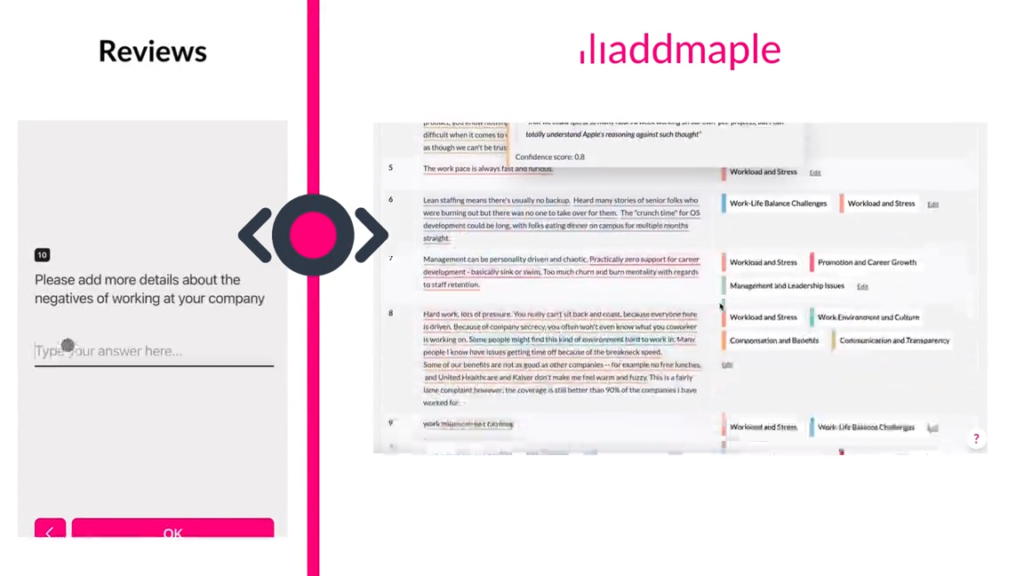
- Code open ends in the same file: Turn free text into themes and sentiment with AI or your own codebook. Each code links to source verbatims and structured survey variables for cross-tab analysis.
- Segment and cluster with confidence: Cut the data by any value, compare subgroups, and keep weighting and significance cues in the same workflow.
- Share without the rebuild: Publish branded Insight Hubs clients can explore, or export editable PowerPoint so stakeholders get interactive outputs and slide-ready charts without starting over in Excel.