Accelerating innovation by exploiting what is already known
Presented at Esomar Fusion Congress by Sjoerd Koornstra (The House of Insights) and Wim Hamaekers (Haystack)
Introduction
Research departments are under pressure.
They are expected to deliver faster, cheaper and more impactful insights than ever before.
Instead of doing more and faster research, insight departments are also able to revisit existing data sources.
Often, companies have plenty of valuable data sources at their disposable, without being aware of their full potential. Moreover, relevant databases are often publicly available via APIs or sold via data brokers.
Yet, the biggest hurdle lies in making sense of this abundance of data. Companies are struggling to connect different sources due to different structures, missing values and other complexities.
In the last years enormous advancements have been made in machine learning and data science. Although demystifying is needed in order to better understand this discipline in context.
With a creative and pragmatic mind-set, the problem can be solved by borrowing techniques from this field of data science.
We show a case – in the beverage industry – where we exploited existing data sources to uncover a hidden layer of insights.
Machine Learning: A Brief Explanation
Machine learning has become a hype, and is used for a various number of things not necessarily correctly.
When you ask people to define machine learning you usually receive the following answer:
Advanced analytical tools which have the ability to learn by so-called self- learning algorithms.
But what does self-learning mean?
We can distinguish within machine learning three different types:
- Supervised
- Unsupervised
- Reinforcement Learning.
Within Supervised and Unsupervised learning no self learning is taking place. In both cases, the learning comes from the amount of data available: the more data available, the more ‘learning’ the system is.
The only type where self learning takes place is Reinforcement, also applied in robots.
It reflects roughly only 1% of all machine learning applications.
Figure 1 shows an overview of the main machine learning tools where half consist of statistical techniques.
Also for these statistical techniques counts; the more data, the higher the predictive value and better estimated results.
We think that machine learning needs a proper definition.
In our view machine learning is an algorithm which:
- Is not assuming certain distributions of the variables /features (no statistical testing)
- Is applied to generate a relationship between input and output but you are not interested in the coefficients
- Is usually using three sub sets to validate the model
- Training: to generate the model
- Validation: to optimise the model
- Testing: to verify the model
This distinguishes real machine learning tools from statistical applications.
The application of machine learning within market research can be seen in automation of research (bot applications, drop out predictions), Text Analytics and Mining, Social Media Analytics, Image Mining and Predictive Modelling.
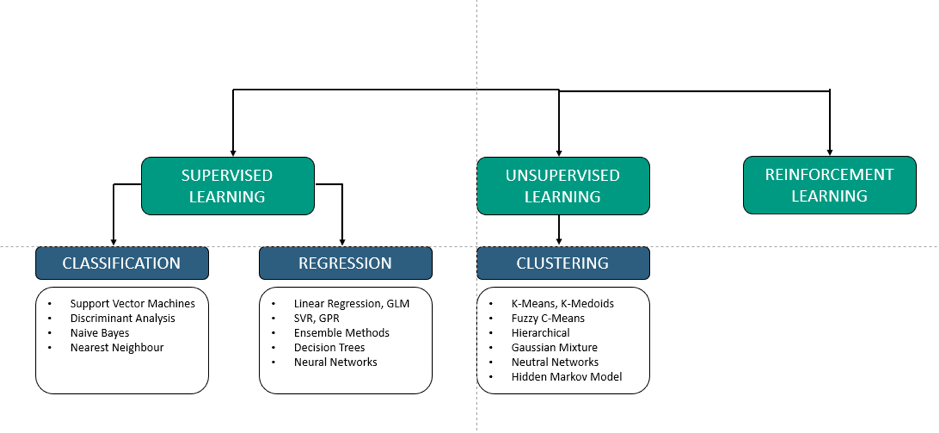
Figure 1. Machine learning algorithms
Why Insights Managers Need to Be Analytics Translators
The knowledge about machine learning within Insights Department is limited.
Insights managers do not know the possibilities of machine learning and have difficulties understanding the results.
The majority of these analyses are performed with machine learning tools by data scientists. Data scientists are needed to build the analysis models and can analyse – but are usually less strong in the interpretation and the link with the business context.
Insights managers are not able to steer and challenge these data scientists.
McKinsey has also recognised this and identified a huge need for analytics translators, the link between data science and the business.
This is described by McKinsey in the article Analytics translator: The new must-have role for the Harvard Business Review.
According to McKinsey translators work closely with the business leaders to understand the business issues and prioritisation.
Translators then use their knowledge of AI and analytics to translate the business issue into a briefing for the data professionals. These data professionals produce models and solutions. The translators then ensure that insights are distilled from these models and solutions that the business can understand and the business can act on.
Domain knowledge is the most important skill that a translator must have. They must be experts in their sector/discipline and company to place the value of AI and analytics in the business context.
They do not necessarily have to be able to build quantitative models themselves. They have to know which model variants are available (e.g. deep learning versus logistic regression) and for which business problem they can be applied.
Translators must be able to interpret the results, discover potential model errors, such as overfitting, and challenge the data scientists.
How does the above relate to Insights Departments?
Today, insights managers play a role that is somewhat similar to translators:
- Working mainly with marketing stakeholders, insights managers identify the business issues and the consumer information needed to make a decision
- They brief agencies and ensure that the correct method is applied.
- They then ensure that research results are translated into information that is necessary for taking business decisions.
Insights managers are the connectors between the business issues and the understanding of consumers.
This domain knowledge is most important for a translator role. It seems logical, therefore, that Insights managers are trained in data science knowledge in order to fulfil this translator’s role.
Case Study:
Machine Learning Helps Create Flavour Insights
An important research question for many beverage companies is which flavours to launch in which markets. In practice, brands usually launch one basic variant, together with two or three flavours, in a given market. Market research is then executed to identify the flavours with the most potential. But this comprehensive research costs time and money. Moreover, some markets are too small/underdeveloped to allocate research budget to, and are therefore neglected research-wise.
Another problem is that consumer research often identifies liquids with enormous consumer rejection – which is often considered a waste of money and resources. Thus, the goal of this project was to develop a tool which would enable to screen certain flavours upfront and check their potential in a given market.
We started to look for data sources already available or available at data brokers with whom we have a long-lasting subscription agreement. We discovered the following data sources
1. Beverage data sources
We looked at categories which are the front runners concerning new flavours. Leading categories are in our view chewing gum, tea and carbonated soft drinks (CSDs).
One of our data brokers had a carbonated soft drinks database. This database contains 517 flavour combinations on category level (not on brand level), from 92 countries and two consecutive years. The flavour could be one flavour, e.g. apple or lime, but also a flavour combination e.g. apple / lime. We put the following assumptions:
- Higher CSD flavour volumes suggest higher potential for beverage category flavours
- Steeper growth (vs decline) over the two consecutive years suggest trending flavours.
2. Beverage flavour launches
We had a subscription to new product launch service. This supplier compiled a database for us consisting of the amount of new flavour introductions in a given country. This concerns 50 new flavour introductions in 73 countries. The assumption is that with more flavour introductions of that certain flavour in a given country, the respective flavour will be more receptive and have a higher volume potential.
3. Company Sales Volume
This data source contains the sales volume from the different flavours in nearly 100 markets in two consecutive years. This database indicates the success and relative importance of in market flavours.
4. Motivational Positioning Platforms
The company has developed so called motivational positioning platforms. This was based upon comprehensive desk research from qualitative motivational studies, which were conducted in several markets globally. Also an assessment was made the of the role different flavours are playing on these motivational positioning platforms.
5. Syndicated consumer flavour appeal / preference studies
One of our data brokers had executed consumer flavour appeal / preference studies. The studies were executed in 25 countries and around 50 flavours were evaluated.
So we had different datasources and we want to assess the potential of each from these 517 flavours per market. How did we continue? We first structured the data in five consecutive steps:
Step 1. Categorizing flavours
As a first step, each of the 517 flavour combinations from the CSD data set were classified in 20 main categories. This was done by sensory experts. A flavour combination could be assigned to more than one category (e.g. “Apple/Lime” would fall into both the Apple category and the Citrus category).
Step 2. Allocating flavours to motivational positioning platforms
Each of the 517 flavour combinations were assigned to the motivational platforms A flavour combination could be assigned to more than one positioning platform. This allocation procedure used as input the categorization of flavours as described in step 1.
Step 3. Calculating new flavour introductions
For each of the 517 flavours, we looked at how many new introductions of that flavour happened in each country. For flavour combinations (e.g. Apple/Lime), we calculated the mean of new introductions of each flavour separately.
Step 4. Adding flavour appeal / preference to the database
Each of the 517 flavours was given a score based on results from the appeal / preference studies. This score ranged from 0% to 100%.
Step 5. Adding CSD volume data + Company Category volume data
The CSD volumes and their absolute growth were added to the dataset. Also the Company volume data was added to the dataset. Volumes of specific flavours were summed up per country.
In total, the complete database consists of 49 features. Every country has 517 lines (rows) in the database given the 517 flavours (one row per flavour).
Eventually, we like to predict the potential for each flavour, in each country. However, the dataset consists of missing variables, which would make it impossible to give a potential score for each flavour in each country. That is why a method was developed to estimate these missing variables.
Not all CSD flavours are on the market in all countries. However, we want to predict the potential CSD volume of a given flavour if it were on the market in a certain country. Additionally, we want to make an estimation of the evolution this flavour would make, as if it would be on the market in that country. These estimations can then be included for the final flavour potential score.
To impute the mentioned missing values, we then employed a predictive algorithm (machine learning method) to extrapolate our data to unknown markets. This predictive tool is a methodology that provides a solution to complex incomplete data problems. This machine learning method searches for patterns in the complete dataset (over all the included parameters: country, positioning platforms, flavour categories, flavour appeal, etc.) and predicts the missing value, based on similarities with other observations.
The motivational positionings platforms have been indispensable for pattern recognition.
The final score ranges from 0 to 100 (the probability of success). We moulded our database into a user-friendly tool. With this tool, stakeholders could easily estimate the probability of success for certain flavours in any given market and could decide to prioritise the potential flavour portfolio.
Final Conclusion
The application yielded an abundance of insights.
In total, the application was able to give indicative insights on almost 50,000 products. To collect similar results with traditional research methods would cost easily over the 100 millions of euros and years of fieldwork.
The tool proved an enormous asset in prioritising R&D and was heavily used by business managers. This case shows that with a creative mind-set, research departments could greatly benefit from connecting existing data sources.
By exploiting what already is known, companies can become more agile entities that are better equipped to meet today’s business standards.
To learn more, join the Demystifying AI for Insights Management webinar on 19th, December 2018, 5:00 pm CET